October 23, 2024
 3 min reading


We cannot argue that this is not strong and confident. It is a first line material for creating a durable and durable product. But when your product is made of a very strong material, you will need even stronger tools to manufacture the product itself, without mentioning a strong understanding of two data and two insights that we can provide about when the machines will need to be repaired or replaced.
Let's consider a forging company – let's call it Silver Dam International – where Bill, a process engineer, is studying the performance of a forging matrix and a fixing device for:
- increase the quality of the crankshaft that is forged; and
- reduce costs for your clients
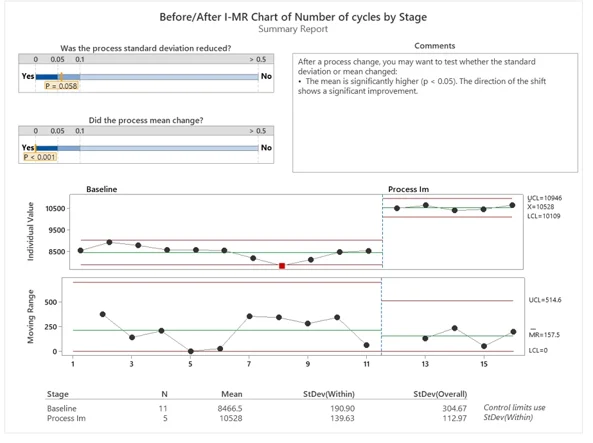
Determination of the base line with a control chart
To begin, Bill asks his team to plot the average number of cycles on a control chart. Minitab To determine a base line:
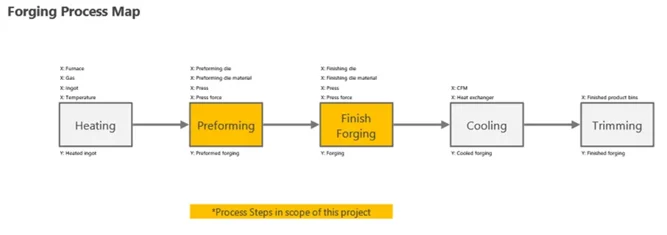
Process mapping
Once the base line is established, we can breed a process map No Minitab Workspace to identify the main stages, inputs and outputs of the process that reveal opportunities for success.
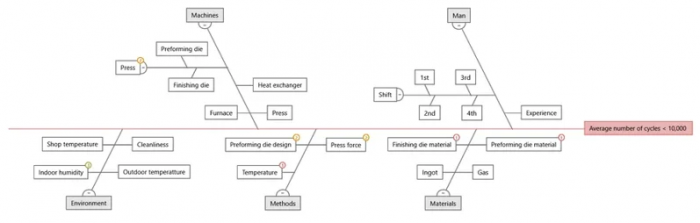
Cause and effect brainstorming
Next, the team can make a simple Cause and Effect Diagram (also known as Fishbone) to brainstorm the possible causes of errors:
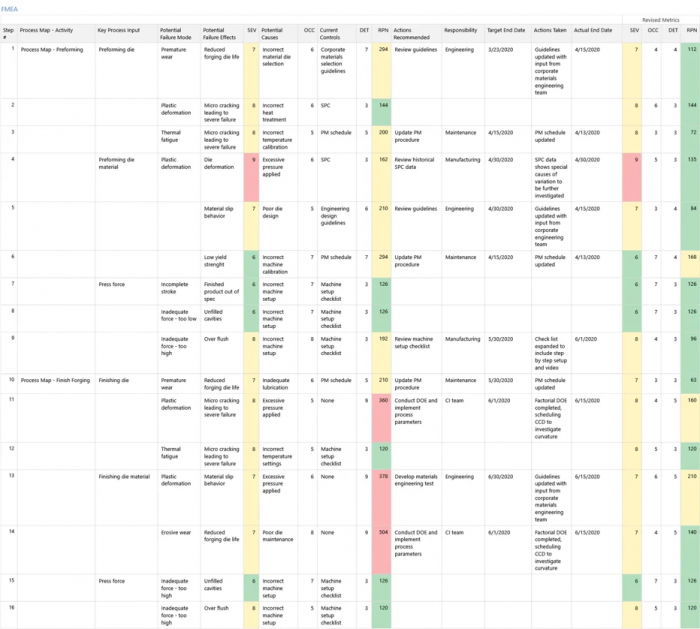
Finally, an FMEA and a control plane to help plot the path for the best
Bill and the team conclude an analysis of the effects and failure modes (FMEA) No Workspace to assess risk and identify opportunities for mitigation. We will document the specification limits, inspection frequency and contingency plans in a Control Plan to ensure that the best results do not last.
Visualizing everything
The forging matrix is a tool that needs to be strong or sufficient so that the metal is forced to assume its shape without deforming or breaking, but you need different types of tools and force it to make an open evaluation of a process with so many variations: its data analysis and project software.
Bill is a Silver Dam International team using a variety of troubleshooting tools to clearly visualize the critical factors affecting the forging process. The team uncovers baseline metrics and process optimization opportunities as collected and analyzed data are not available. Minitab, which can be easily clicked with the direct mouse button and imported to or Minitab Workspace. From there, we visualize the process on a process map, do a cause and effect brainstorming with a fish spine diagram and a general plan of how to eliminate waste and address the most critical inputs of the process with its FMEA and Control Plan documents.
It is useful to work with a set of tools that complement each other and a common goal to help you achieve your vision of success!
Talk to me Software.com.br and know better Minitab together with a specialist.